2026 · Published · arXiv
TwinBI
BI 대시보드의 상태와 조작 방식을 에이전트가 이해할 수 있게 만든 디지털 트윈입니다.
An agentic digital twin for efficient augmented interactions with business intelligence dashboards.
대시보드를 단순한 화면으로 보지 않고, 차트와 필터, 데이터 의미를 함께 담은 모델로 표현했습니다. 에이전트는 이 모델을 보고 어떤 조작을 해야 할지 판단합니다.
TwinBI builds a digital twin of BI dashboards so agents can reason over dashboard state, user interactions, and analytic context before taking action.
01 · 배경 Background
대시보드 상태 이해
Dashboard State Understanding
BI 대시보드는 회사가 매출, 비용, 고객, 운영 현황 같은 지표를 확인하는 가장 익숙한 도구다. 사람은 차트 제목, 필터, 축, 색상, 표의 관계를 보며 “지금 어떤 기준으로 데이터를 보고 있는지”를 자연스럽게 이해한다.
하지만 에이전트에게 대시보드는 그냥 버튼과 그래프가 놓인 화면으로 보일 수 있다. 사용자가 어떤 지표를 보고 있는지, 필터를 바꾸면 집계 기준이 어떻게 달라지는지, 같은 숫자라도 어떤 의미 체계 안에서 계산된 것인지 모르면 그럴듯하지만 틀린 답을 만들기 쉽다.
특히 기업 BI에서는 지표 정의, 시간 범위, 집계 단위, 필터 범위가 중요하다. 자연어로 “지난달 매출이 왜 줄었어?”라고 물어도, 실제로는 어떤 매출 지표인지, 어떤 지역과 제품군을 포함하는지, 현재 대시보드 상태가 무엇인지까지 맞춰야 한다.
TwinBI는 LLM이 대시보드를 대체한다기보다, 대시보드와 함께 일하게 만들자는 문제의식에서 시작했다. 차트, 필터, 분석 스키마, 현재 상호작용 상태를 에이전트가 읽을 수 있는 디지털 트윈으로 표현해, 자연어 대화와 실제 BI 조작 사이의 간격을 줄이고자 했다.
BI dashboards are familiar tools for monitoring revenue, cost, customer, and operational metrics. Human users naturally read chart titles, filters, axes, colors, and tables as one analytic state.
For an agent, however, a dashboard can look like a set of disconnected buttons and charts. If the agent does not know which metric is being viewed, how filters change the aggregation, or which semantic definition a number follows, it may produce fluent but analytically inconsistent answers.
Enterprise BI depends on precise metric definitions, time windows, aggregation grains, and filter scopes. A question such as “why did revenue drop last month?” requires alignment with the dashboard’s current state and business semantics, not only natural-language fluency.
TwinBI starts from the idea that LLM agents should work with BI tools rather than replace them. It represents charts, filters, analytic schemas, and interaction state as a digital twin so that natural-language assistance can stay grounded in executable BI state.
02 · 방법 Method
에이전트가 다루는 대시보드 트윈
Agentic Dashboard Twin
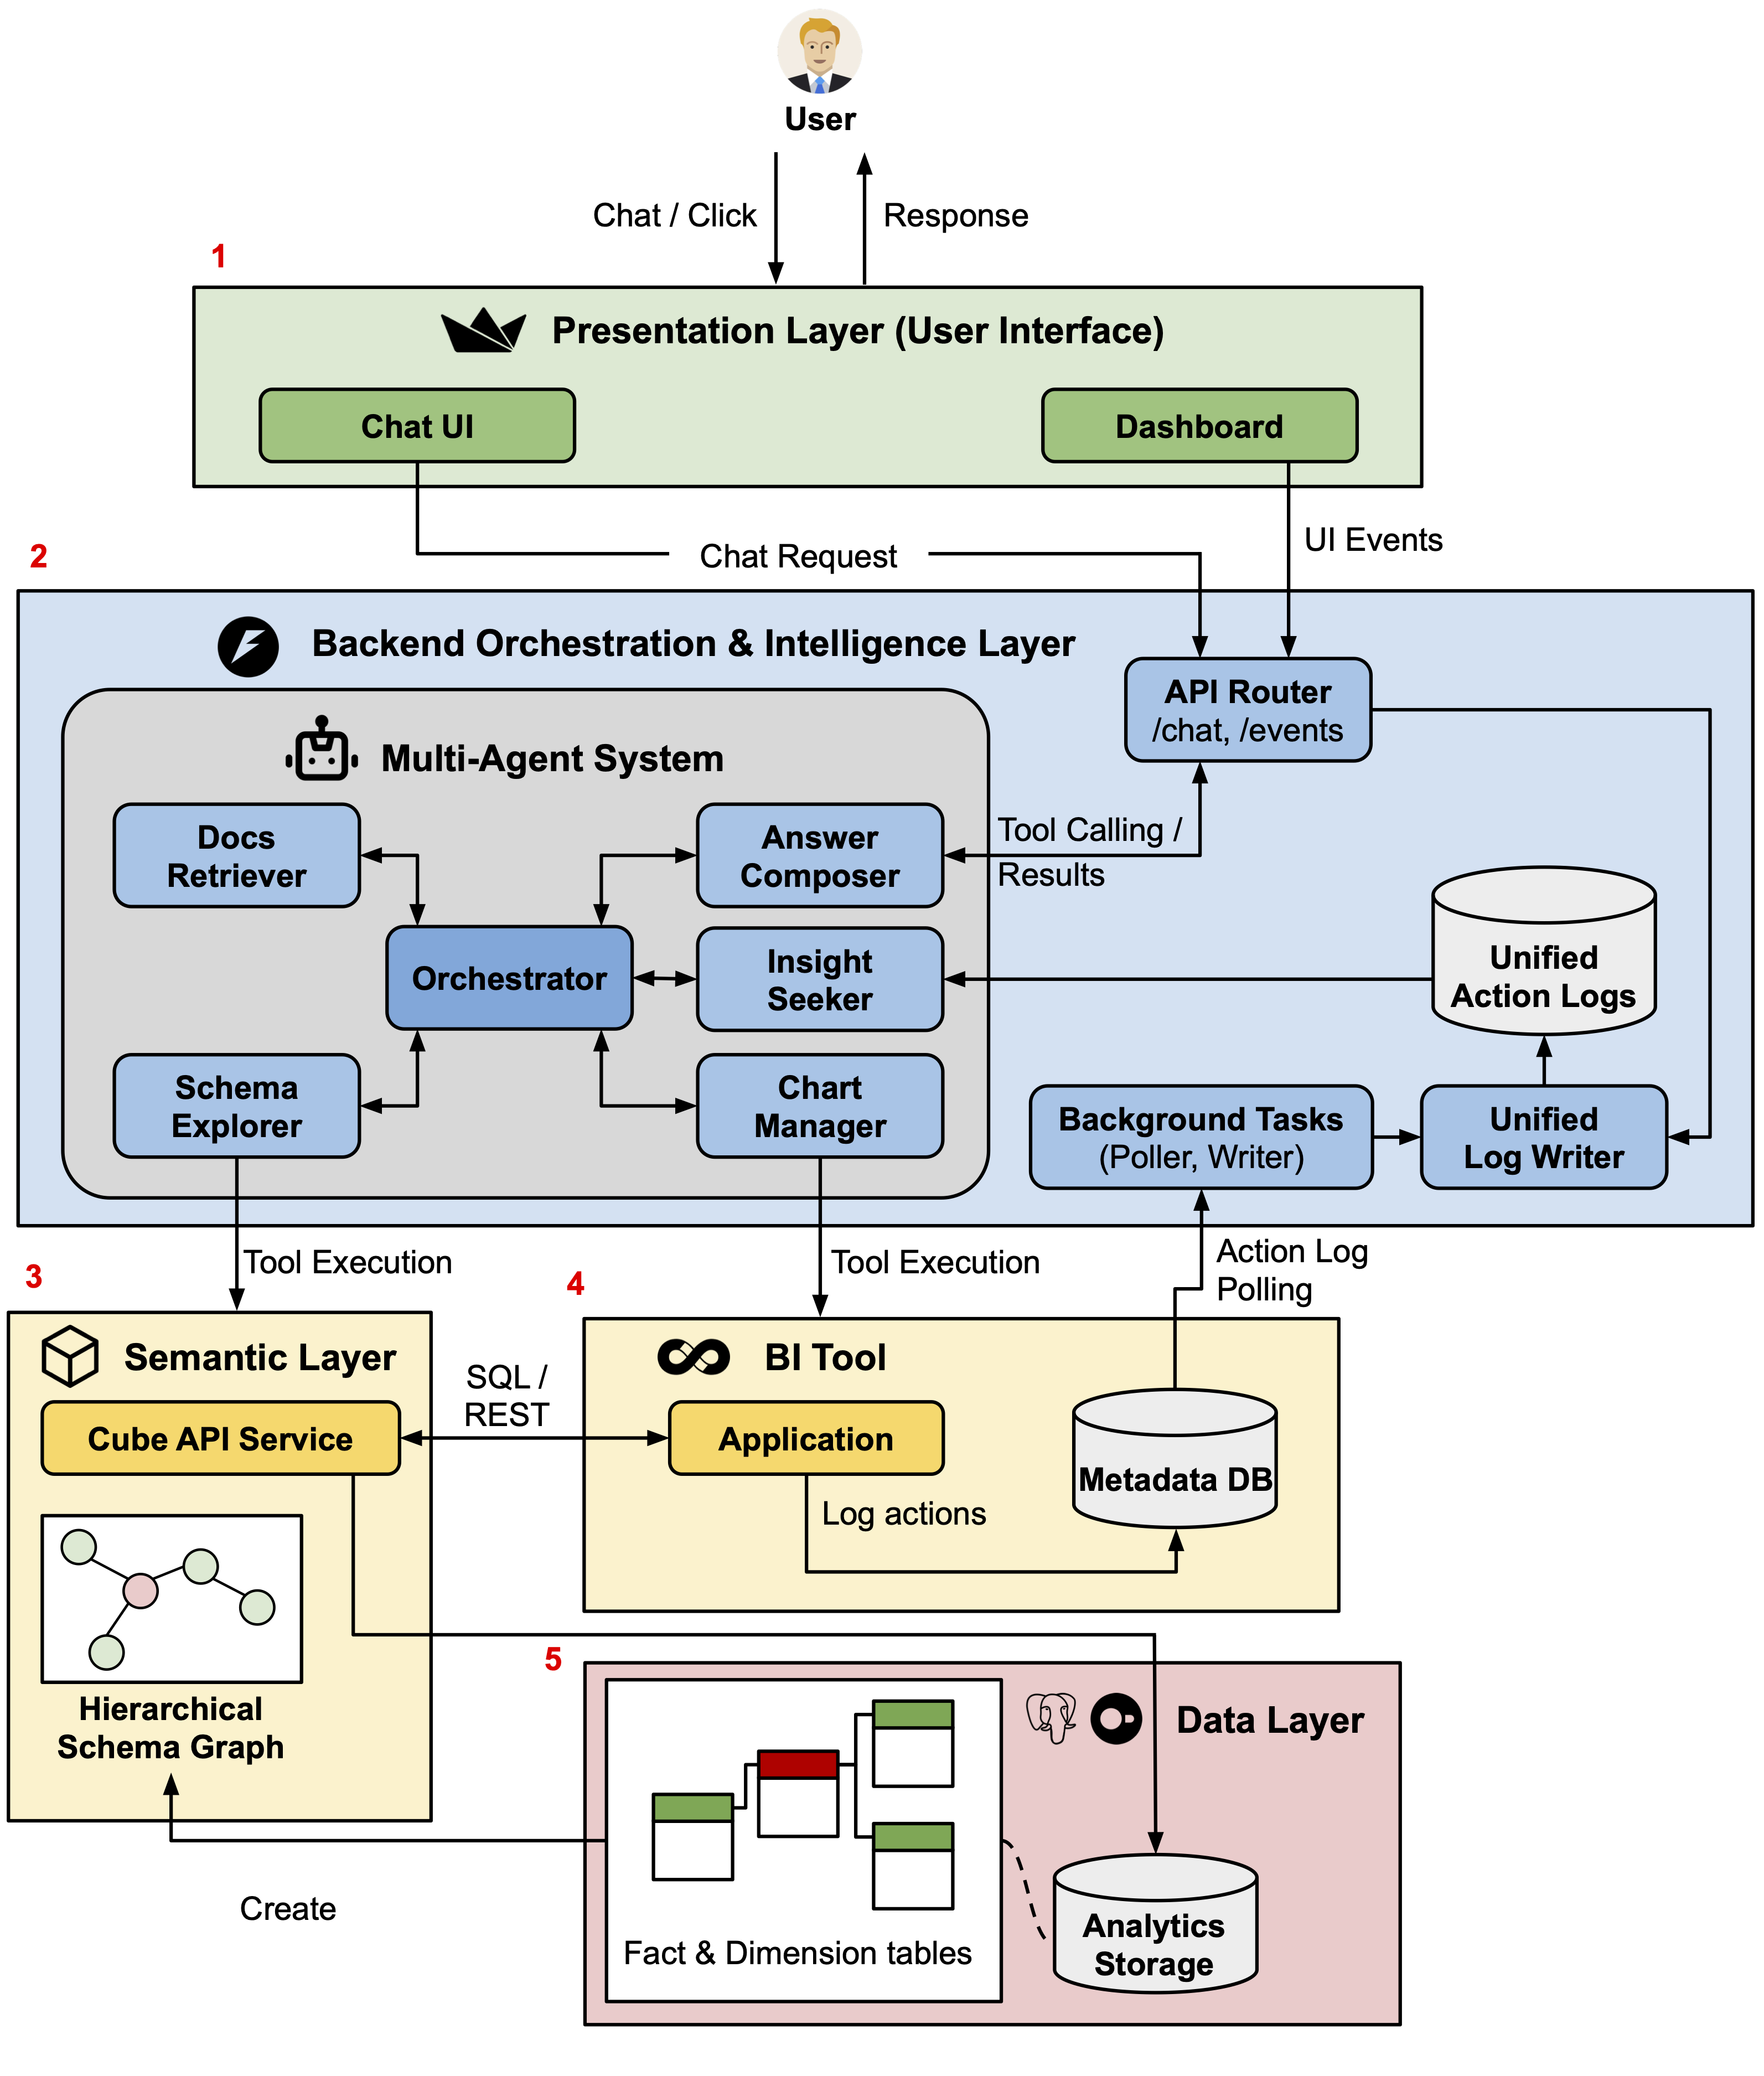
TwinBI는 두 개의 트윈을 맞물리게 만든다. 하나는 사용자의 의도와 에이전트의 추론 과정을 다루는 LLM agent twin이고, 다른 하나는 실제 대시보드의 필터, 차트, 지표, 쿼리 상태를 담는 BI twin이다.
사용자가 대시보드를 클릭하거나 채팅으로 질문하면, TwinBI는 그 행동을 하나의 interaction log로 남긴다. 이 로그에는 탭 이동, 필터 선택, 차트 클릭, 채팅 질문, 도구 호출, SQL 실행 같은 사건이 같은 흐름 안에 저장된다.
백엔드는 이 로그를 바탕으로 현재 분석 상태를 다시 만든다. 예를 들어 사용자가 이미 특정 분기와 부서를 선택했다면, 다음 자연어 질문은 그 상태를 무시하지 않고 같은 필터와 지표 정의 위에서 해석된다.
또 SQL, schema view, interaction log, `/insights` 같은 검증용 도구를 함께 노출했다. 사용자가 최종 답만 받는 것이 아니라, 에이전트가 어떤 데이터와 쿼리 상태를 근거로 답했는지 확인할 수 있게 하려는 설계다.
TwinBI connects two twins: an LLM agent twin that handles user intent and reasoning, and a BI twin that represents filters, charts, metrics, queries, and executable dashboard state.
When the user clicks through the dashboard or asks a chat question, TwinBI records the event in a unified interaction log. Tab switches, filter changes, chart clicks, chat turns, tool calls, and SQL executions become part of the same analytic trace.
The backend reconstructs the current analytic state from this log. If the user has already selected a quarter and department, the next natural-language question is interpreted under that same filter and metric context instead of starting from a blank prompt.
TwinBI also exposes SQL, schema views, interaction logs, and an `/insights` command as inspection artifacts. The goal is to let users verify the evidence behind an answer, not only read the final response.
03 · 결과 Results
상태를 아는 BI 상호작용
State-Aware BI Interaction
평가는 두 가지로 나누어 진행했다. 첫 번째는 같은 모델과 같은 30-step 제한을 둔 A/B benchmark다. Dashboard-only 조건은 화면만 보고 조작했고, TwinBI 조건은 같은 화면에 더해 채팅과 backend context를 함께 사용했다.
30개 분석 질문에서 TwinBI는 exact match를 43.33%에서 63.33%로, partial-credit accuracy를 48.33%에서 70.83%로 올렸다. 평균 step도 16.47에서 6.90으로 줄어, 단순히 더 많이 탐색해서 맞춘 것이 아니라 상태를 읽는 방식이 더 효율적이었다.
실패 양상도 달라졌다. Dashboard-only는 tooltip hover나 필터 전환을 반복하다 timeout에 걸리는 경우가 많았지만, TwinBI는 같은 dashboard state를 chat query와 연결해 필요한 값을 더 직접적으로 회수했다. Timeout은 40.00%에서 10.00%로 줄었고 invalid action은 10.93%에서 0.00%가 됐다.
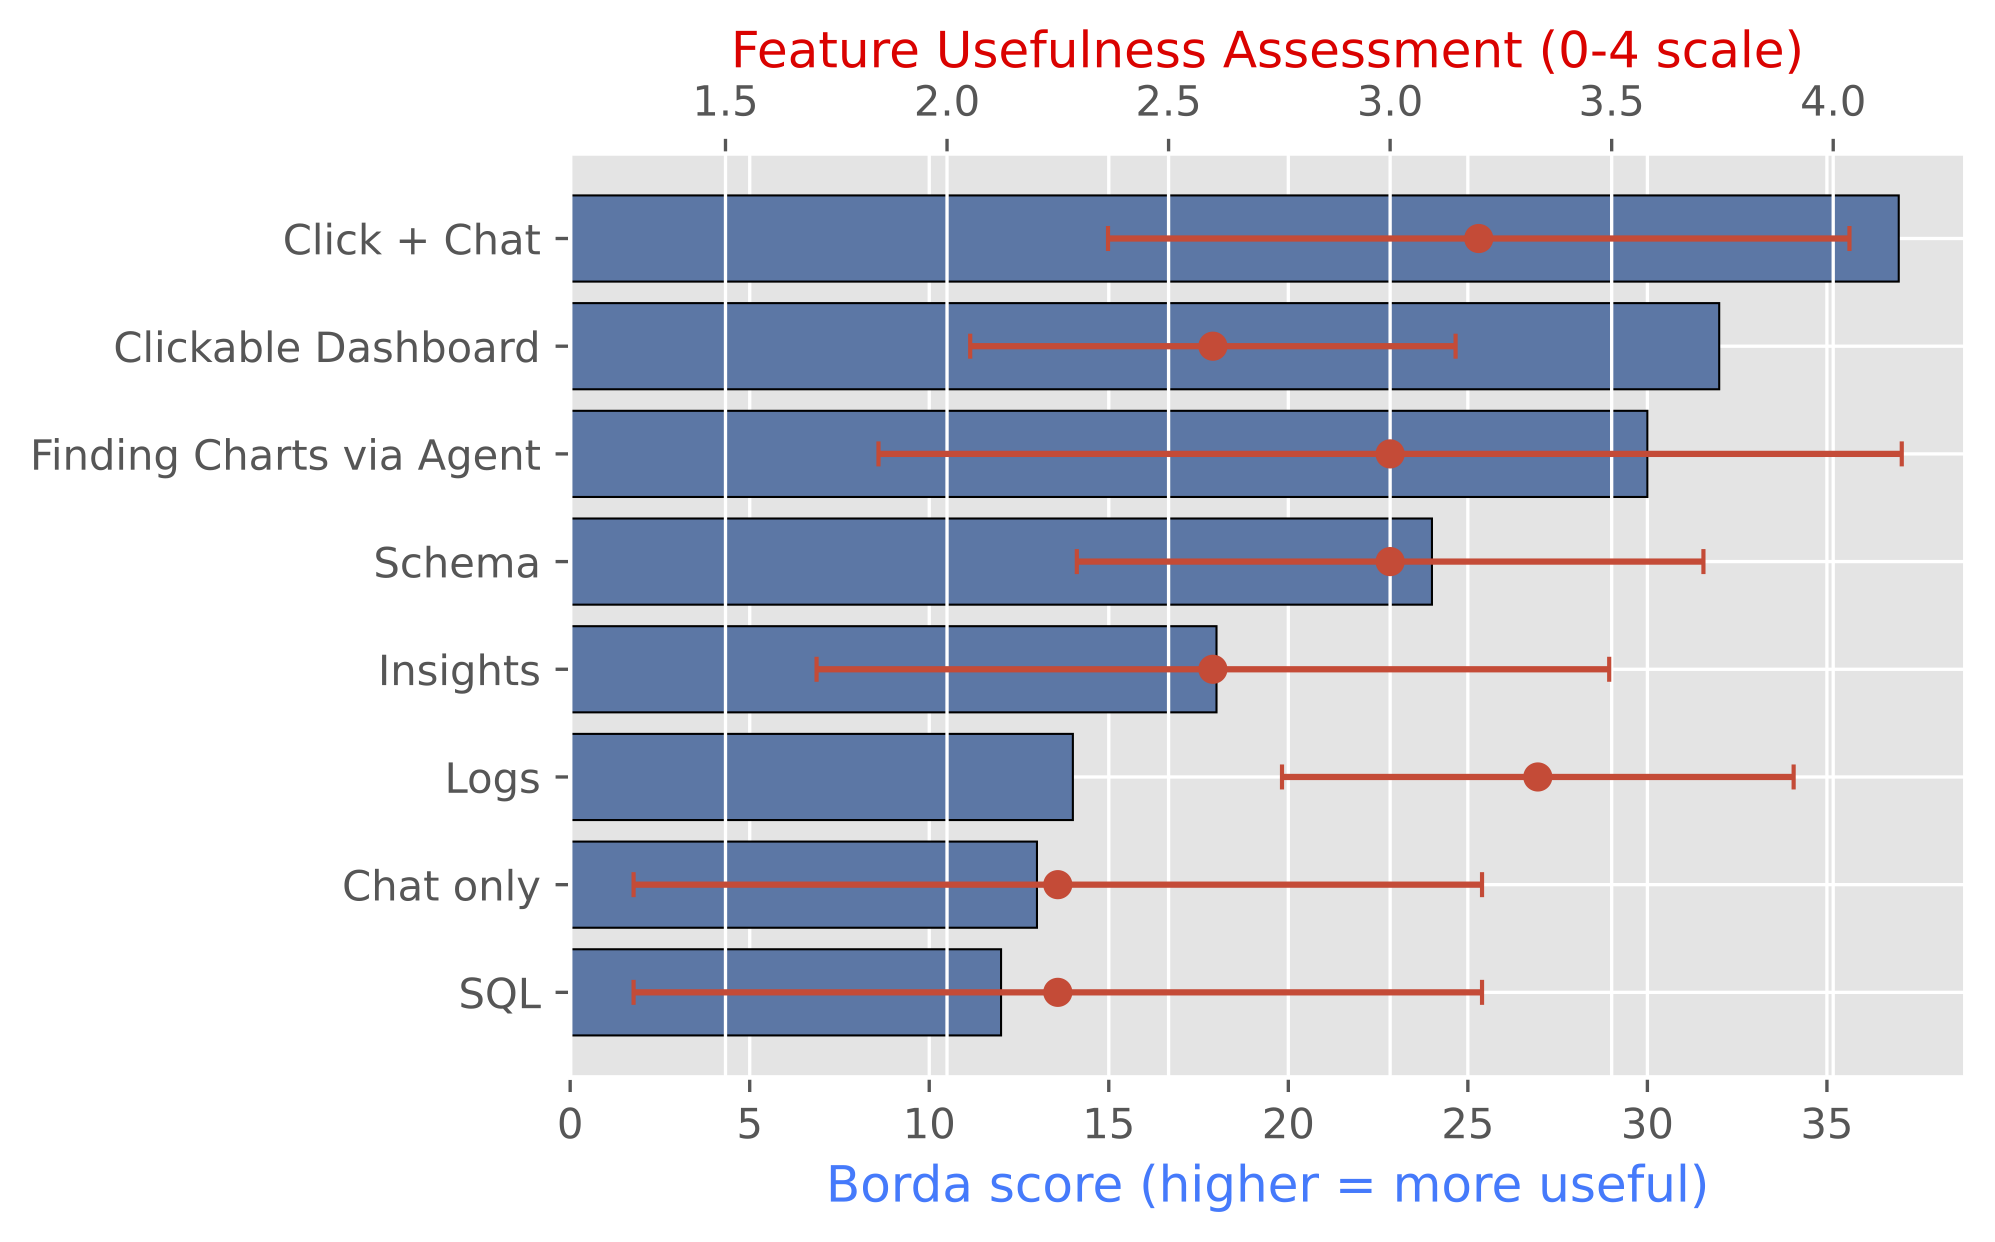
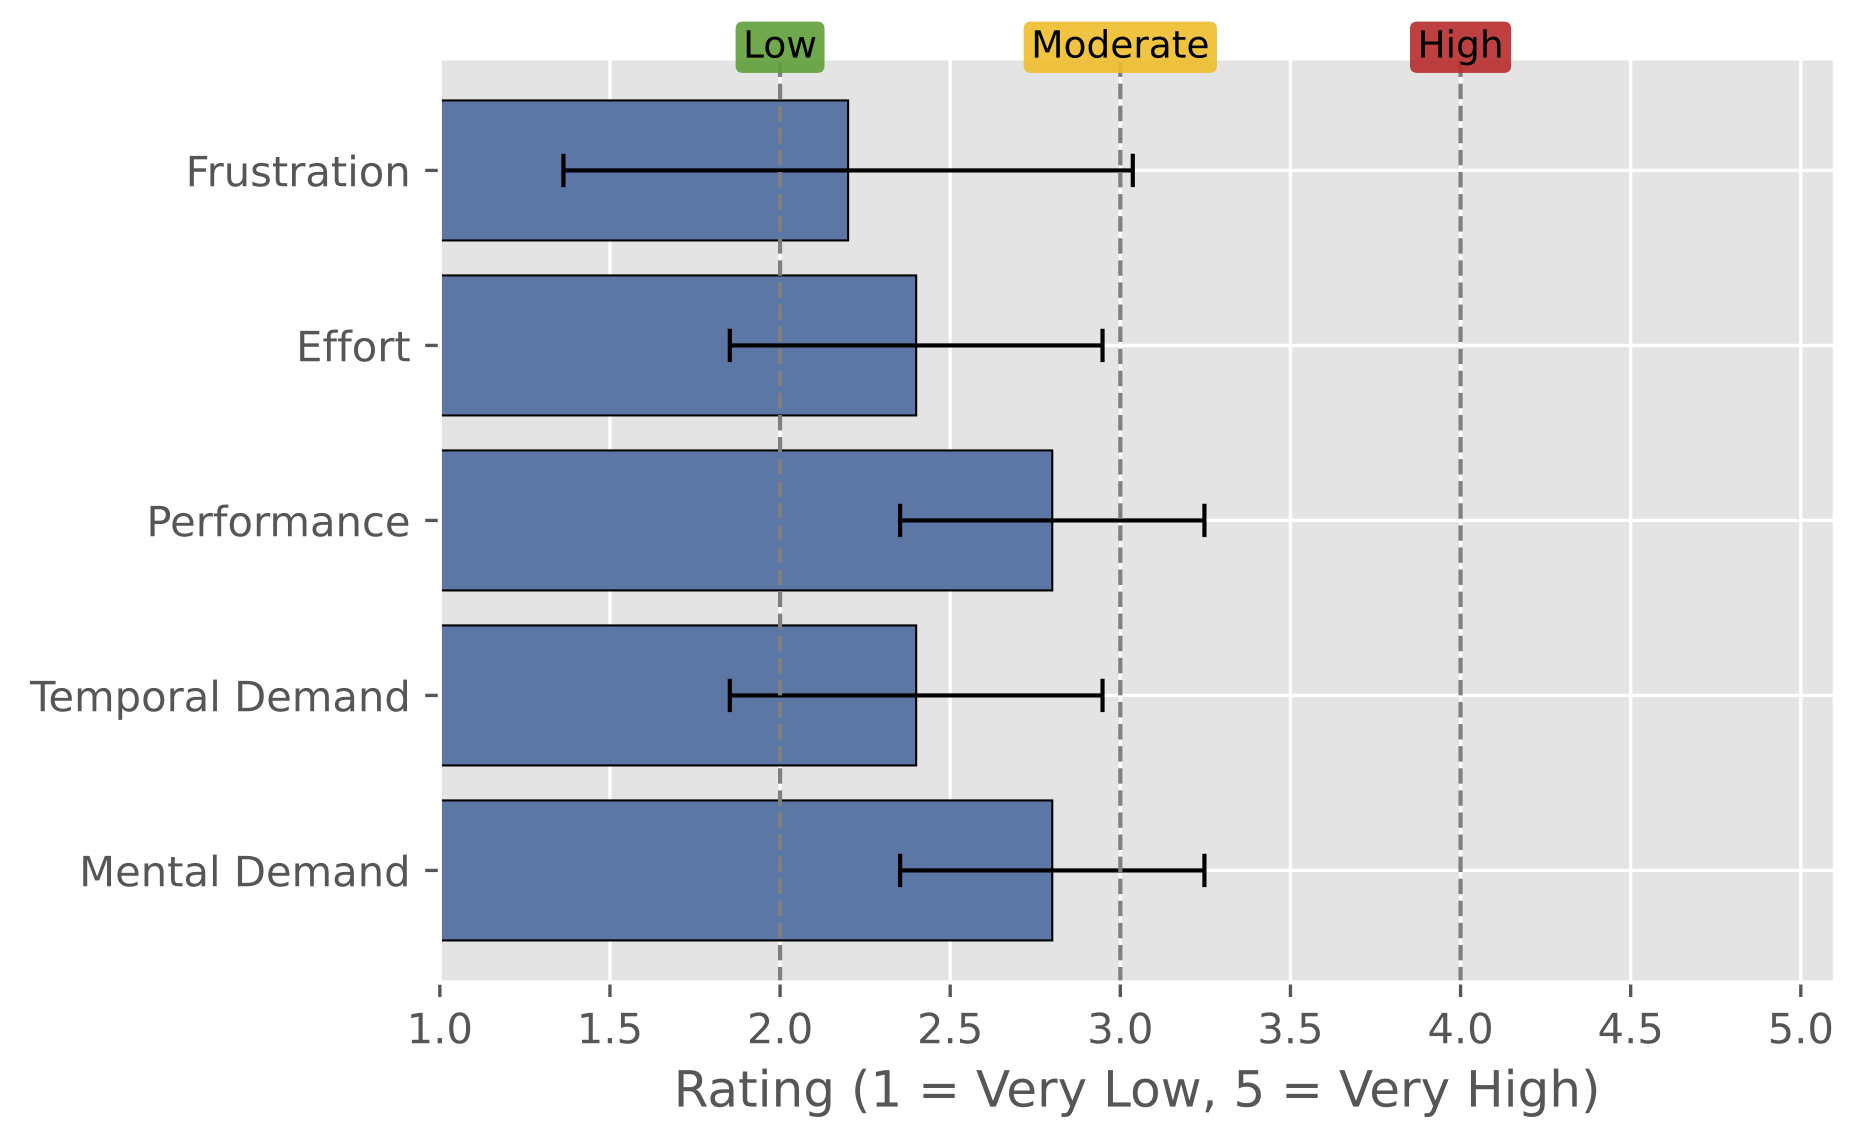
두 번째는 사용자 평가다. 참가자들은 대시보드로 먼저 맥락을 잡고, 필요한 비교나 설명은 채팅으로 이어 가는 방식을 자주 사용했다. 표본은 작지만, 상태를 아는 dashboard+chat workflow가 복잡한 분석 시나리오에서 사용 가능하다는 신호를 보여줬다.
The evaluation had two parts. First, a controlled A/B benchmark used the same model and the same 30-step budget. The Dashboard condition relied on visible dashboard interaction, while the TwinBI condition added chat and backend state support.
Across 30 analytic questions, TwinBI improved exact match from 43.33% to 63.33% and partial-credit accuracy from 48.33% to 70.83%. Average steps dropped from 16.47 to 6.90, suggesting that state grounding improved efficiency rather than merely adding more exploration.
The failure pattern also changed. Dashboard-only runs often got stuck in repeated tooltip probing or filter switching, while TwinBI could connect the same dashboard state to a chat query and recover the needed value more directly. Timeout rate fell from 40.00% to 10.00%, and invalid actions fell from 10.93% to 0.00%.
The second evaluation was a user study. Participants often used the dashboard to establish context and then used chat for comparison, explanation, or summary. Although the sample was small, the study suggests that a state-aware dashboard+chat workflow is usable for moderately complex analysis.
- 차트, 필터, 조작 함수, 분석 맥락을 하나의 트윈으로 표현
- Exact match 43.33% → 63.33%, partial-credit 48.33% → 70.83%
- Timeout 40.00% → 10.00%, invalid action 10.93% → 0.00%
- Integrated dashboard objects, functions, and analytic context as a digital twin
- Exact match improved from 43.33% to 63.33%; partial credit from 48.33% to 70.83%
- Timeout fell from 40.00% to 10.00%; invalid actions from 10.93% to 0.00%
04 · 시사점 Reflection
클릭보다 중요한 상태 이해
State Understanding over UI Automation
이 연구에서 가장 중요한 시사점은 대시보드 자동화의 핵심이 클릭 위치 찾기가 아니라는 점이다. 에이전트가 잘 도와주려면 “지금 화면이 어떤 분석 상태를 뜻하는지”를 알아야 한다.
채팅과 대시보드를 따로 두면 상태가 쉽게 어긋난다. 사용자는 화면에서 필터를 바꾸고 있는데, 채팅은 이전 질문만 기억하거나 반대로 대시보드 상태를 모르는 답을 할 수 있다. TwinBI는 이 둘을 같은 interaction log로 묶어야 한다는 방향을 보여준다.
한계도 분명하다. 사용자 실험 규모가 작고, 더 복잡한 차트에서 값을 안정적으로 읽는 문제는 아직 남아 있다. 또한 사용자가 어떤 분석 슬롯을 채우고 있는지, 어떤 가정을 바꿔 보고 있는지를 더 세밀하게 추적해야 한다.
다음 단계는 여러 데이터셋과 더 다양한 사용자에게서 확인하는 것이다. 한 대시보드에서 만든 분석 상태를 다른 대시보드로 옮기거나, 단순 질의응답을 넘어 보고서 작성과 의사결정 흐름까지 이어 주는 방향으로 확장할 수 있다.
The main lesson is that dashboard automation is not primarily about finding where to click. A useful agent has to understand what analytic state the current screen represents.
When chat and dashboard interaction are separated, state can drift. The user may change filters on the screen while the chat remembers only the previous question, or the chat may answer without knowing the dashboard state. TwinBI shows why these two modes need a shared interaction log.
The limitations are also clear. The user study is small, and robust value extraction from complex charts remains hard. The system also needs better tracking of analytic slots, assumptions, and partial decision states.
The next step is validation across more datasets and more diverse users. Another direction is transferring analytic state across dashboards and extending the workflow from question answering to reporting and decision support.